From high-level revenue reporting to program and channel-specific KPIs, digital marketing initiatives create a lot of data. That information is required for calculating ROI and campaign performance, but it is not so simple to comprehend.
You can’t assess your current marketing plan or measure the performance of your campaigns without a sufficient method to collect data without a good technique to track your marketing KPIs, such as a marketing KPI dashboard.
As a result, marketing dashboards are critical to any marketing team’s performance. They not only compile all of the data and campaigns that have had a beneficial influence on a business, but they also show you how to improve your current plan.
What Is a Marketing Dashboard, and How Does It Work?
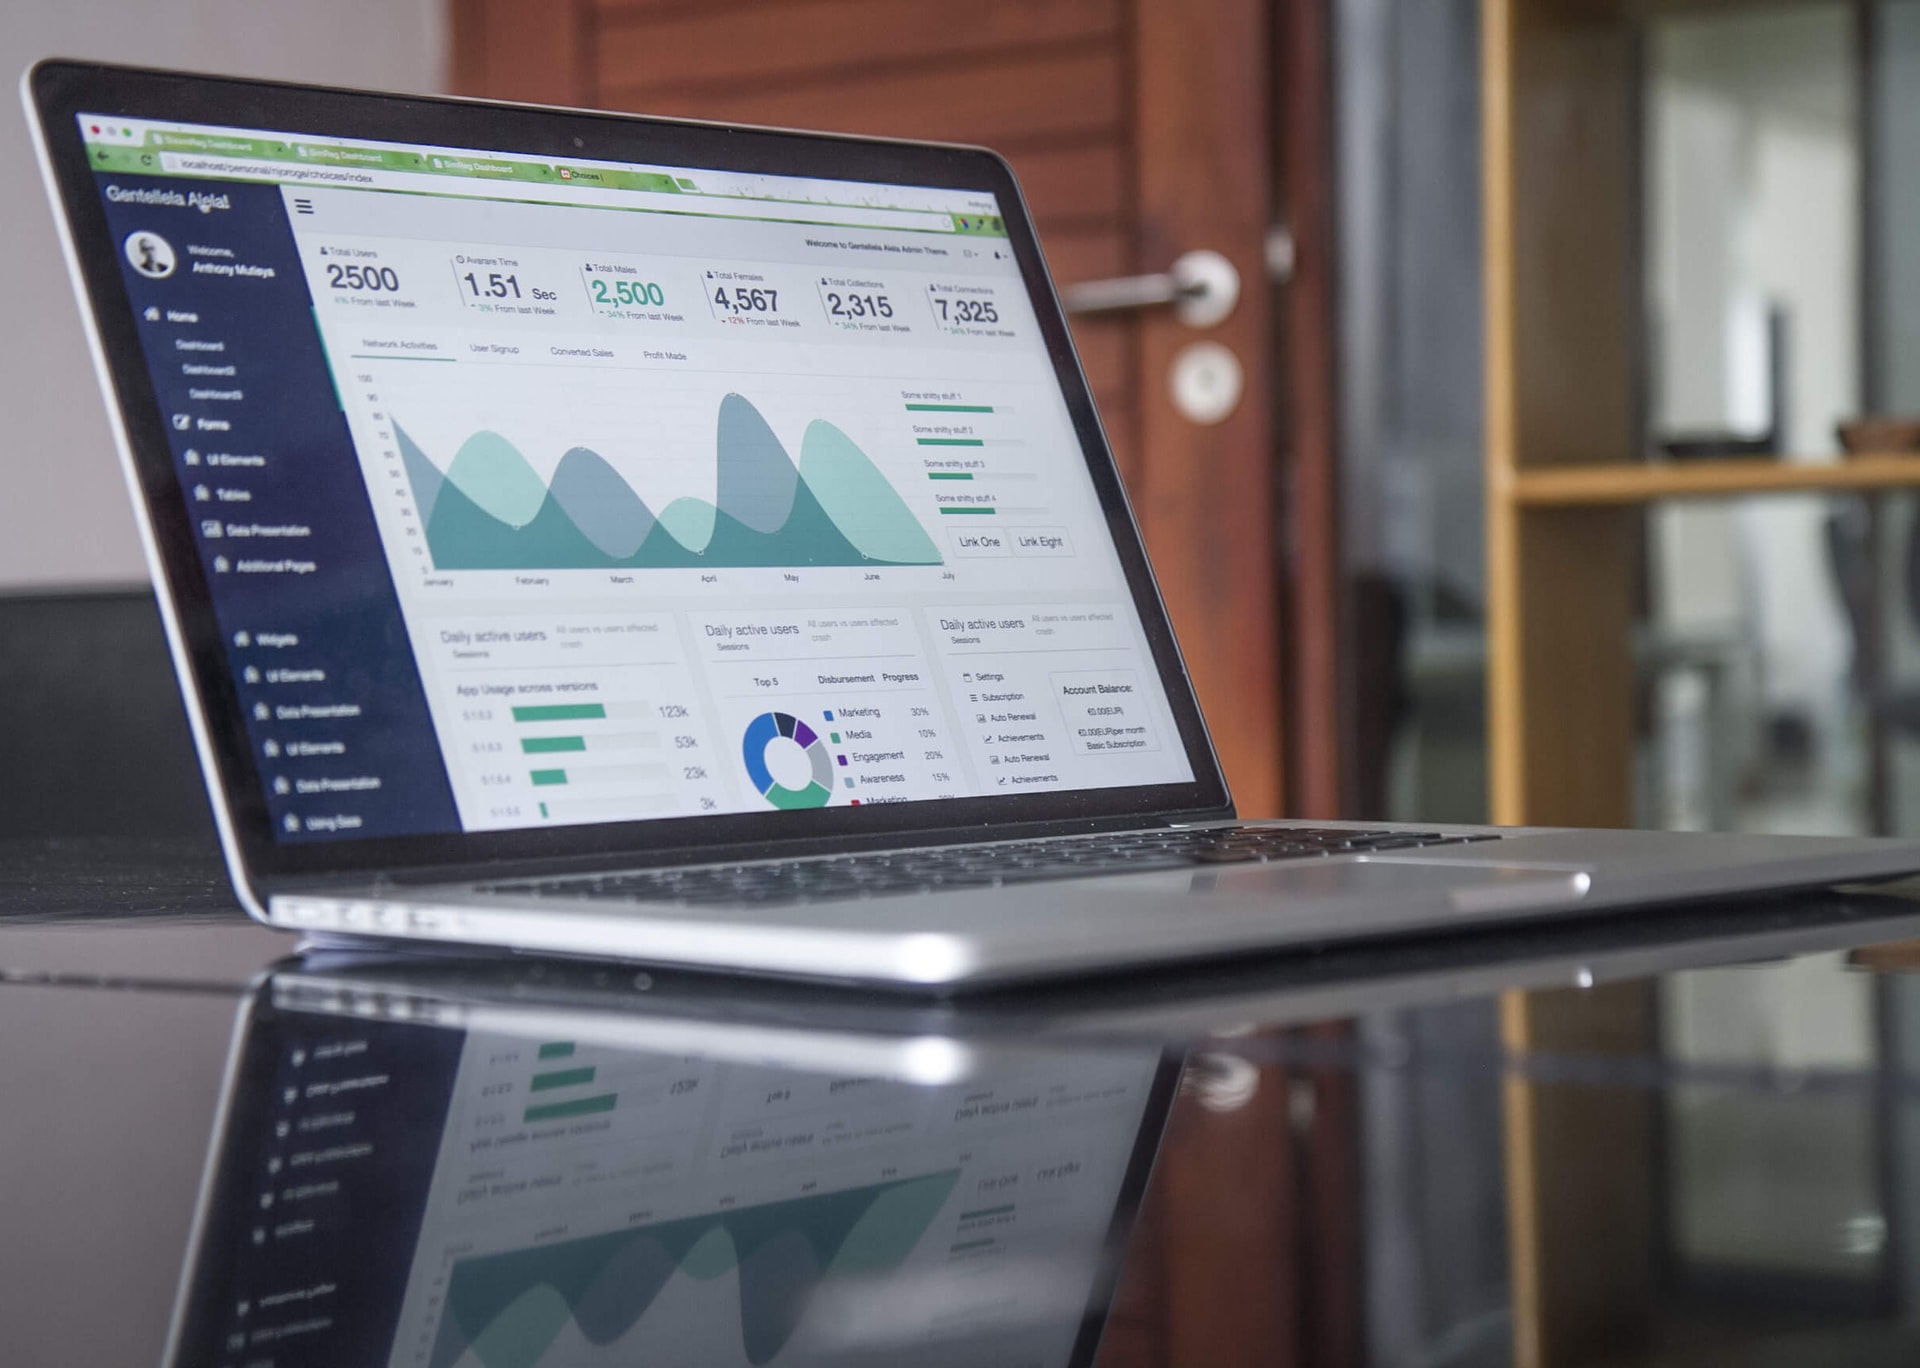
A marketing dashboard is a data visualization platform that collects, analyzes, and visualizes all marketing data collected by a firm for its marketing operations. With full marketing dashboards, you can gather all the data you need about your campaign’s performance and distribute it to marketing teams in an easy-to-understand manner.
Statistics that assess the total impact of a company’s marketing strategy on the market and performance of marketing activities will be included in a successful marketing dashboard.
It would help if you incorporated metrics from your different marketing platforms and web analytics data sources, such as your Google AdWords ads, email campaigns, and Google Analytics data. Furthermore, metrics from various social media sites are also important.
1. Sisense
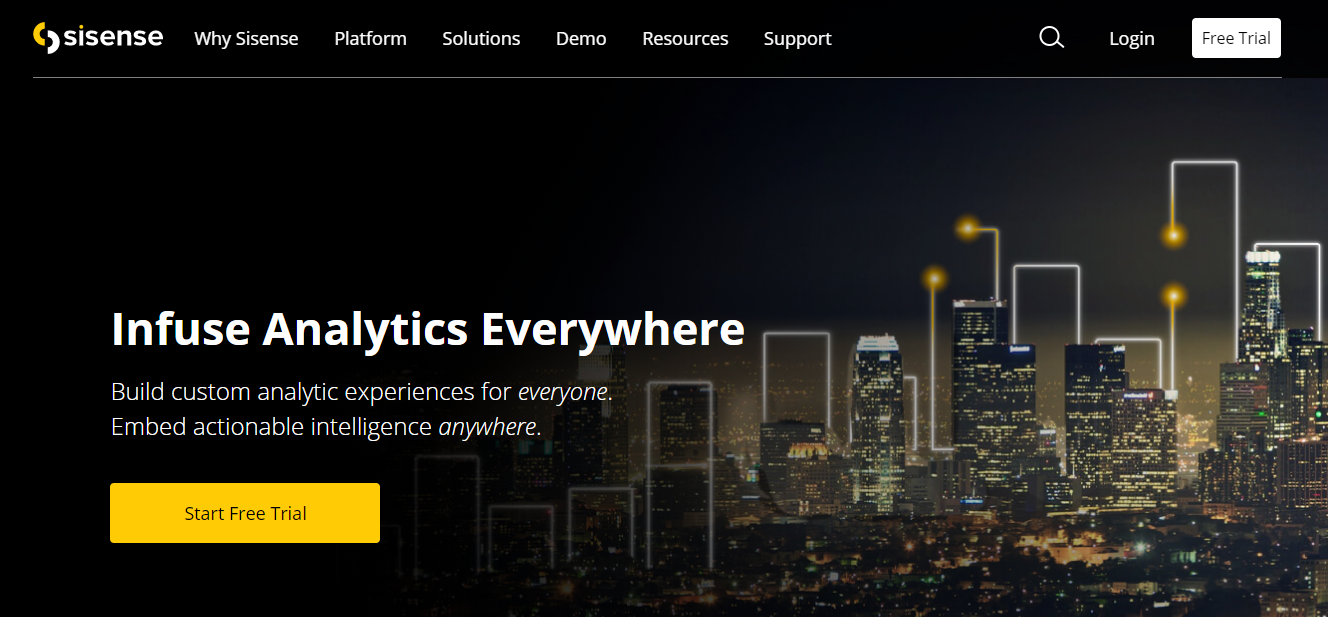
Sisense is a business intelligence program that provides small to enterprise-level companies with analytic solutions and market insights. It is a fully functional business intelligence software solution that allows non-technical people to merge numerous data sources, configure dashboards, create data visualizations, and share them with others.
The program’s data visualization tools include several widgets, such as line charts for determining trends and pie charts for comparing results. To administer the system, learn new scripts, and maintain manual mashups, you don’t need a DBA.
Furthermore, you can execute BI analyses with Sisense’s drag-and-drop interface. Such an interface allows you to handle business intelligence in-house, saving you money on the costs of keeping a technical staff or paying for expert services.
Features:
- Database “Elasticube” (speeds performance at the terabyte scale)
- Controls on access
- Automatic alerts
- Scheduled refreshes
- Built-in connectors
- Eye-catching visual design
- Data may be exported as PDF, Excel, Images, CSV, and other file types
2. Grow
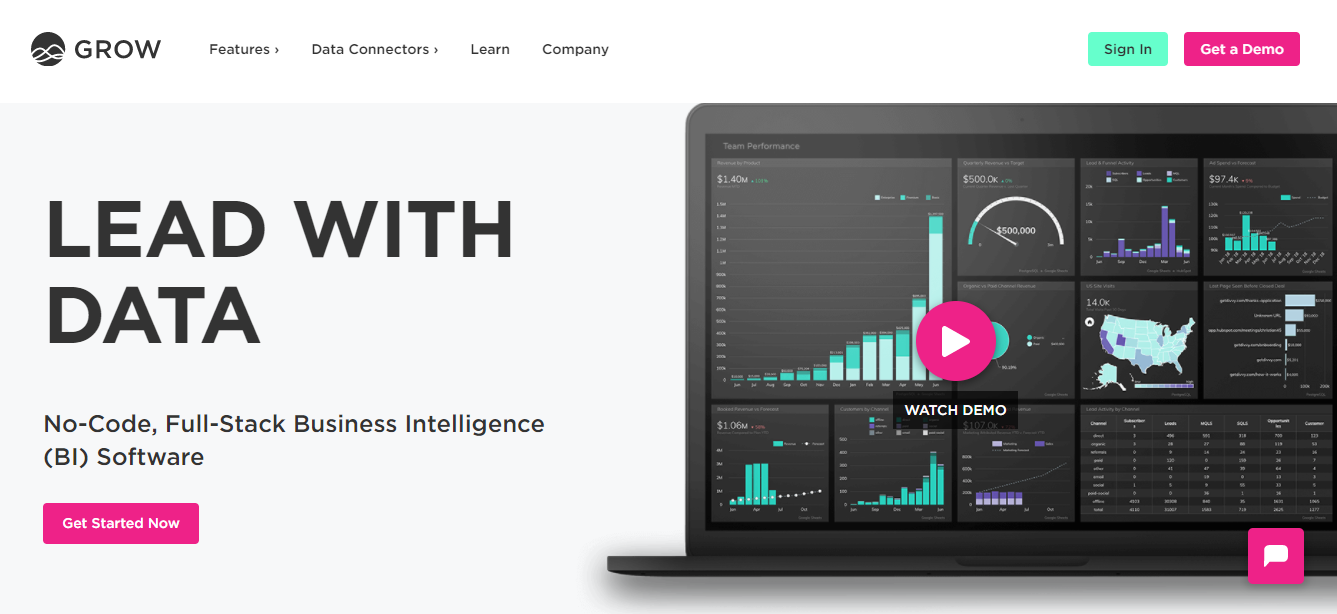
Grow is a cloud-based data visualization tool that enables customers to gain insights from their data and utilize them to improve their companies. The vendor created it to assist in developing small and mid-sized organizations in accessing actionable insights.
Through the use of simple dashboards, Grow helps organizations to become data-driven and accelerate their growth. Furthermore, Grow’s data dashboards make it simple to combine and mix data from hundreds of different sources, including spreadsheets, databases, and SaaS apps.
Grow also interacts with various applications, including Salesforce, QuickBooks Online, HubSpot, Shopify, etc. In addition, this tool’s data consultants assist users in setting up the data dashboard and resolving any issues that may arise.
Features:
- Mobile access
- Over 150 integrations
- No coding requirements for visual editors
- No limits on the number of people
- Real-time data updates indefinitely
3. HubSpot
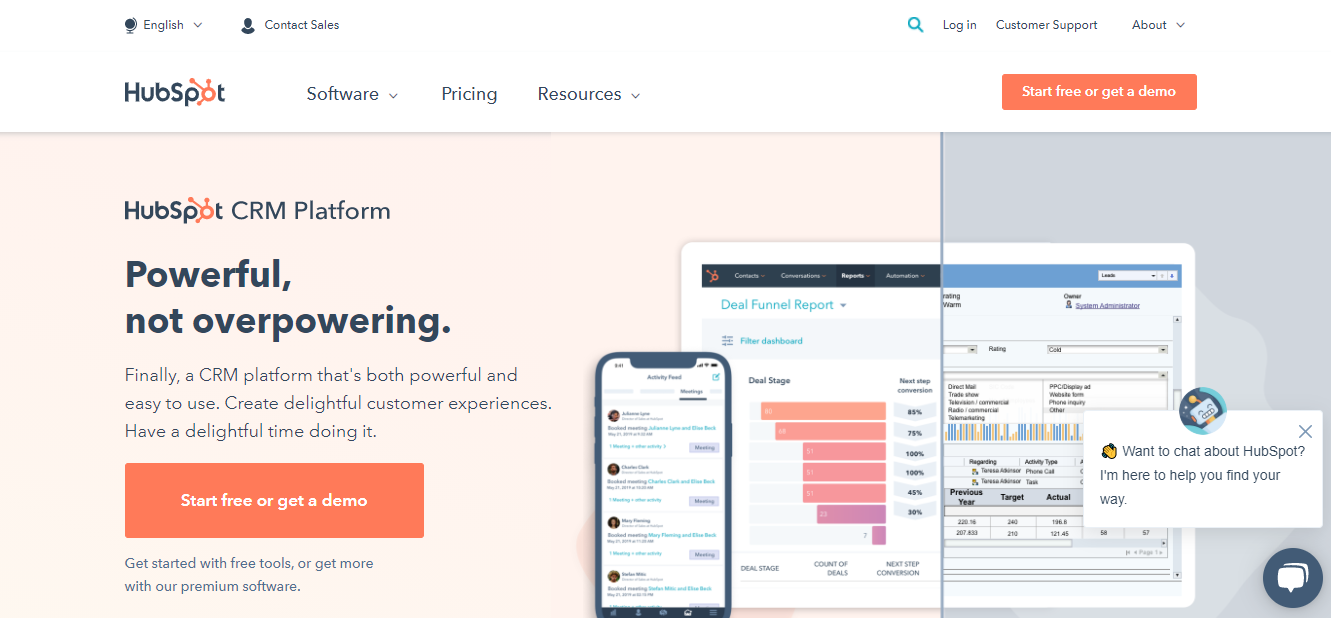
HubSpot is a comprehensive CRM platform in the ranks of monday.com that includes all of the tools you’ll need to improve your business, whether you’re looking to boost leads, enhance sales, optimize customer support, or create a great website.
With HubSpot, you can create personalized dashboards and reports in seconds. It connects your CRM contact, business, and deal data with your marketing, sales, and service data, making it simple to produce reports to answer even the most complicated inquiries.
Furthermore, to make the custom report builder even more powerful, you can effortlessly import data into HubSpot using custom objects and link your favorite applications via the HubSpot App Marketplace.
4. Cyfe
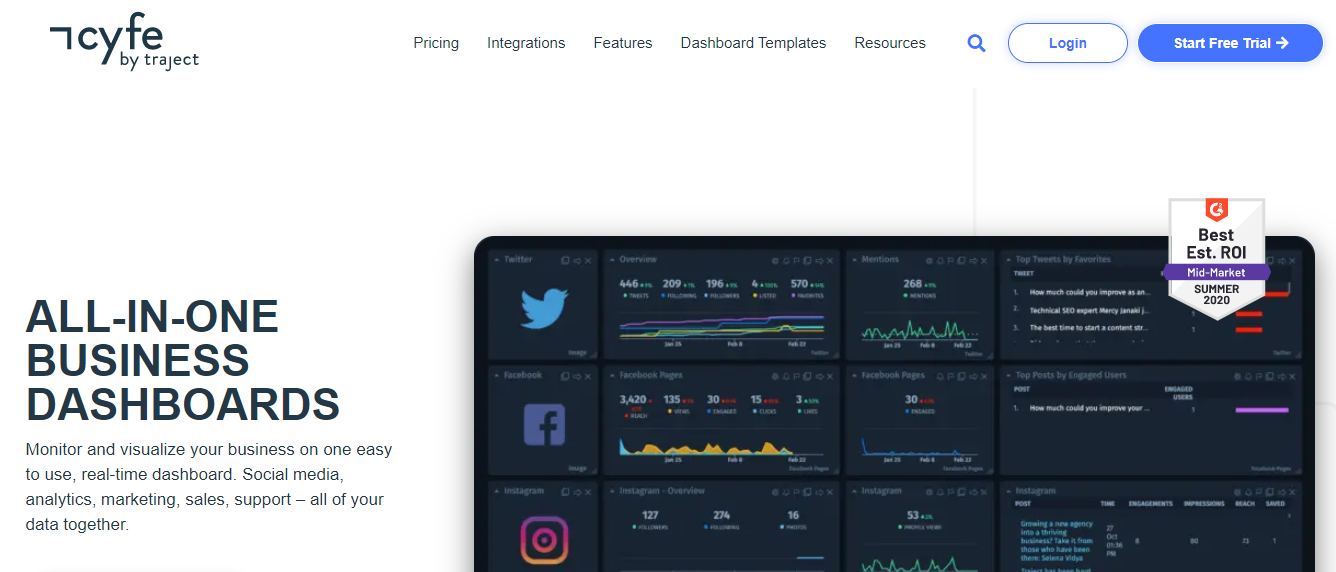
Cyfe is a web-based, all-in-one company dashboard that combines data from marketing channels, online analytics, finance, sales, and social media, among other sources. The dashboard is free to use with up to five distinct data sources.
Still, a subscription edition is available for enterprises with more complex requirements (unlimited data, exports, user accounts, public URLs, etc.). In addition, many various services, such as Moz site analytics, keyword ranking data, and social media networks, may be accessed directly by Cyfe without the need for a membership.
Features:
- No data limitations (with premium edition)
- Television mode
- Branding customization
- Historical data archiving
- Displays by Cohort
- Integration with over 60 services
- Useful data
5. Tableau
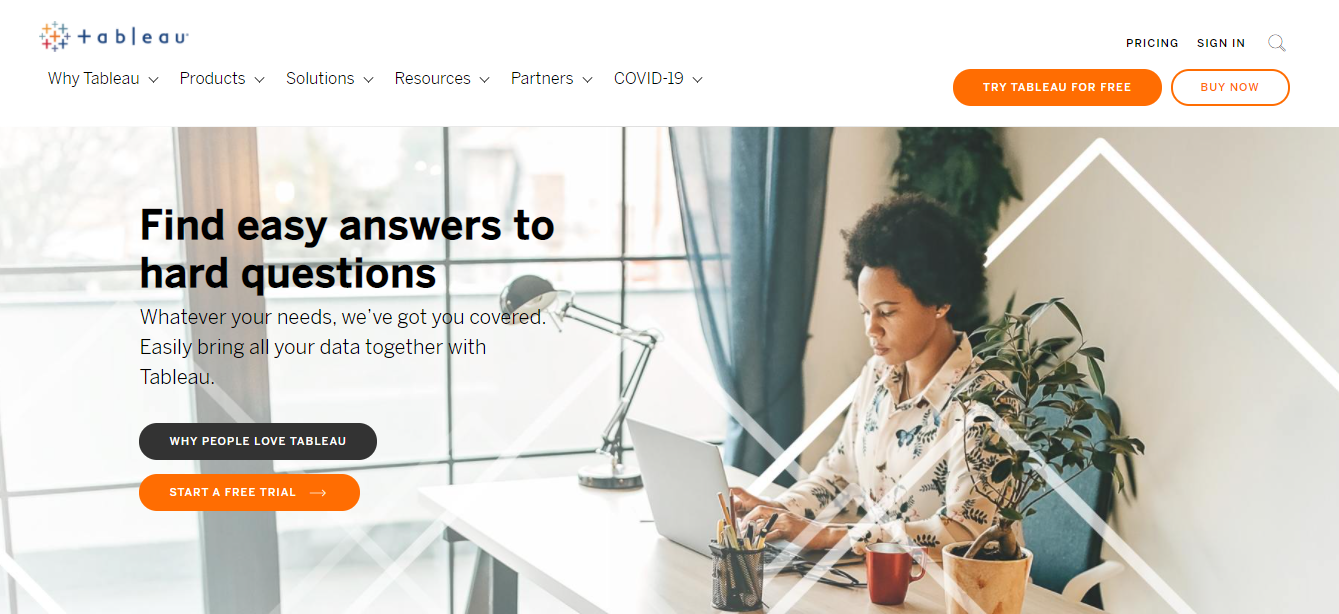
Tableau is a data visualization application that you can use online or on-premises. It is a leader in the business intelligence area due to its innovation and solid platform.
This application offers you beautiful charts and graphs, affordable pricing for everyone, and many real-time data sources. Furthermore, Tableau has a thriving community that connects to everything from GitHub to Twitter.
In addition, the connections community publishes open-source documentation to enable Tableau users to link to as many data sources as possible. This means that if your data connection is missing, you may create it yourself (or with the help of a developer).
Features:
- Data connectors library provided by the community
- Accessible public data sources
- Embedded analytics
- Cutting-edge visuals
- Regular software updates
Conclusion
Marketing dashboards that measure important data and KPIs are essential for staying ahead of the competition and marketing your company or organization. They’ll help with decision-making and budgeting, as well as determining whether or not your techniques are effective.
To improve your efforts, save time, and obtain a higher return on investment, think about implementing these digital marketing dashboards into your business.